DOE
- shaira214
- Oct 29, 2022
- 3 min read
Updated: Jan 25, 2023
In chemical product design journey, there is experimentations being involved. You may ask yourself, where do I begin? Or you may try to find a way to do things more easily and systematically.
Design of Experiments (DOE) is a:
A statistics-based approach to designing experiments.
A methodology to obtain knowledge of a complex, multi-variable process with the fewest trials possible.
An optimisation of the experimental process itself.
The backbone of any product design as well as any process/ product improvement efforts.
Case Study:
What could be simpler than making microwave popcorn? Unfortunately, as everyone who has ever made popcorn knows, it’s nearly impossible to get every kernel of corn to pop. Often a considerable number of inedible “bullets” (un-popped kernels) remain at the bottom of the bag. What causes this loss of popcorn yield? In this case study, three factors were identified:
Diameter of bowls to contain the corn, 10 cm and 15 cm
Microwaving time, 4 minutes and 6 minutes
Power setting of microwave, 75% and 100%
8 runs were performed with 100 grams of corn used in every experiments and the measured variable is the amount of “bullets” formed in grams and data collected are shown below:
Factor A= diameter
Factor B= microwaving time
Factor C= power
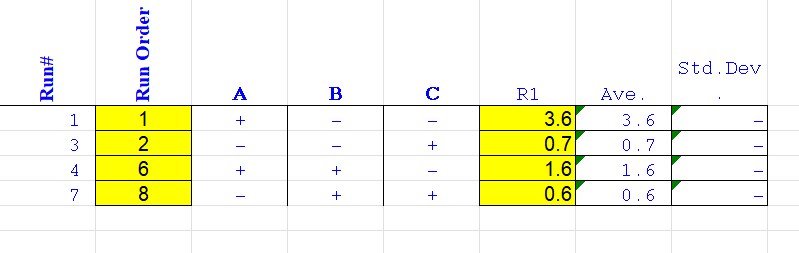
FULL FACTORIAL
Run Order | Diameter of bowl (A) | Microwaving time (B) | Powe Setting of Microwave (C) | Average Bullets (grams) |
1 | + | - | - | 3.63 |
2 | - | + | - | 2.63 |
3 | - | - | + | 0.74 |
4 | + | + | - | 1.63 |
5 | + | - | + | 0.95 |
6 | + | + | + | 0.32 |
7 | - | + | + | 0.63 |
8 | - | - | - | 3.12 |

The total number of experiments needed to be carried out:
N = r x 2^n,
Where, n = number of factors r = number of replicates
For r = 1, N = 1 × 𝑟3 = 8
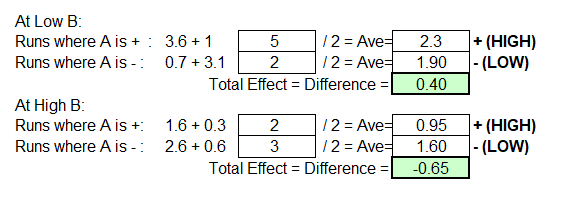
Effect of single factors:


Where 1 is Low and 2 is High.
From the graph above, we can infer that
When the diameter increases from 10cm to 15cm, the mass of "bullets" increases from 1.625g to 1.75g.
When the microwaving time increases from 4minutes to 6minutes, the mass of "bullets" decreases from 2.10g to 1.275g.
When the power setting of the microwave increases from 75% to 100% , the mass of "bullets" decreases from 2.73g to 0.65g.
From this we can infer that Power setting of the microwave (Factor C) is the most significant, followed by Microwaving time (Factor B), and Diameter is the least significant (Factor A).
Link to excel for FULL FACTORIAL: Topic7-3 DOE CPDD template for data analysis (3).xlsx
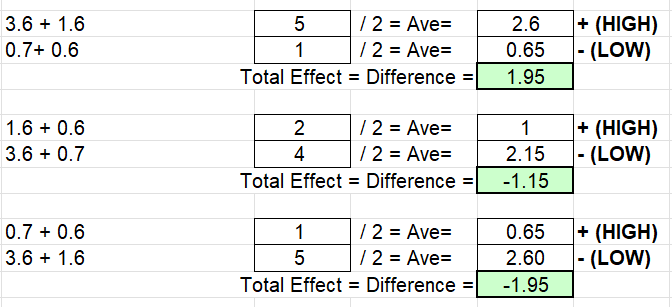
Determine the interaction effects.
A X B

The gradient of both lines are different, which shows there is a significant interaction between Factor A (Diameter) and Factor B (Microwaving Time).
A X C

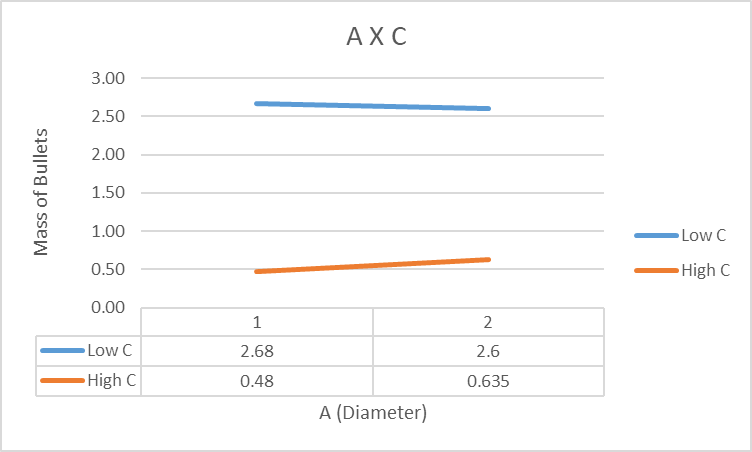
The gradient of both lines (Low C and High C) are different. This shows that there is significant interaction between Factor A (Diameter) and Factor C (Microwave Power).
B X C

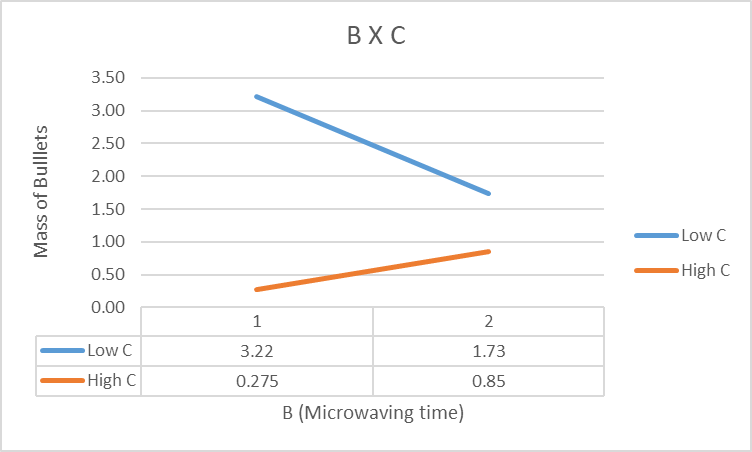
The gradient of both lines are different. Therefore, there is a significant interaction between B (Microwaving Time) and C (Power Setting).
To conclude, the power setting of the microwave, for Full Factorial, decreases the mass of "bullets" most significantly, followed by microwaving time and lastly, diameter.
FRACTIONAL FRACTORIAL
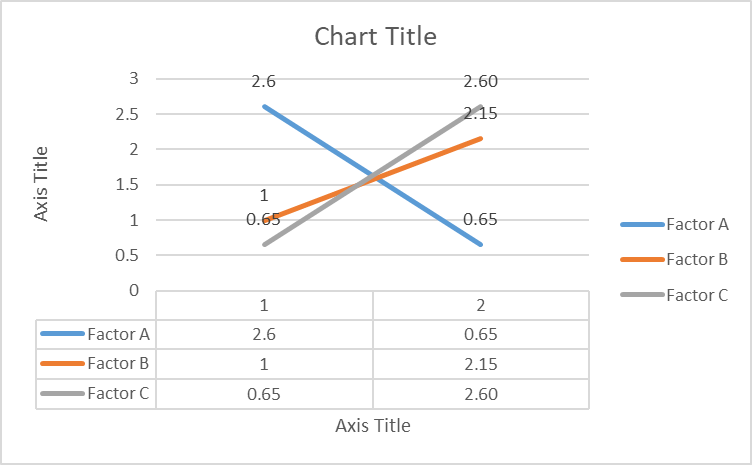
From the graph above, we can infer that
When the diameter increases from 10cm to 15cm, the mass of "bullets" increases from 2.6 to 0.65.
When the microwaving time increases from 4minutes to 6minutes, the mass of "bullets" increases from 1 to 2.15.
When the power setting of the microwave increases from 75% to 100% , the mass of "bullets" increases from 0.65 to 2.60.
Learning reflection
I feel that I enjoyed and learn a lot from this experiment compared to others. I learnt that it is realistic to perform fractional factorial compared to full factorial, by restricting the number of runs. However, although saves time and resources, we risk missing information. With the help of my lecturer, I also learnt how to plot graphs on Excel, and to observe trends of each factors.
I created an excel sheet before the experiment, so that my groupmates and I just have to simply key in the values into the excel during the experiment itself. I was also surprised that when the length of the arm of the catapult increases, the flying distance decreased. I always though that increasing length of catapult would increase the length the ball travelled.
All in all, Design of Experiment was very fun and interesting to me.


Comments